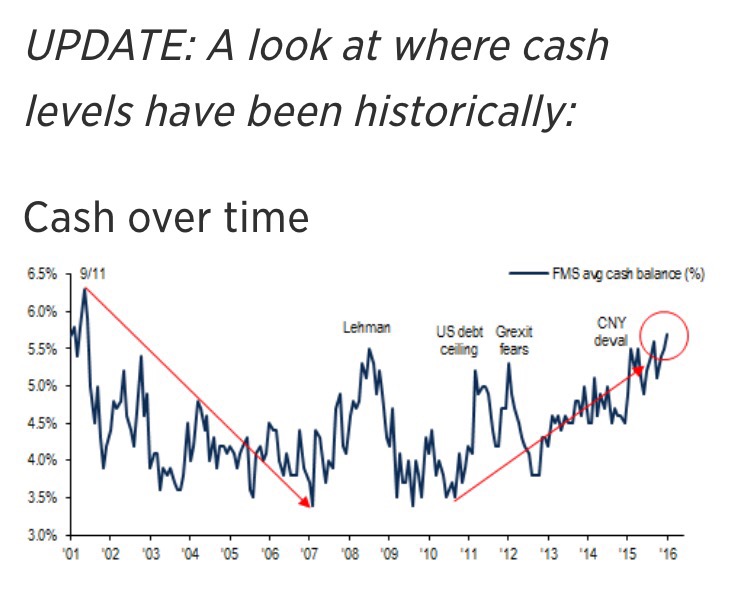
I found this chart to be kind of comical in the sense that it signifies almost nothing. Yet, it’s been cited by a big bank and it’s hit the CNBC newsfeed. Could a 2.5% swing in the level of current cash holdings in mutual funds mean all that much? Seems like an insignificant squiggly line to me.
About Jason P. Tank, CFA, CFP, EA
Jason is the founder of Traverse City, Michigan-based Front Street Wealth Management, the independent, fee-only wealth advisory firm for individuals, families and trusts who value proactive management of their investments and a deeper confidence in their wealth.
